


THE SHORT VERSION • FCNR depositors borrowed at 5.7-5.8% to earn 6-6.25%, levered up to 9-19x, on a belief that the underlying deposit carried a defacto sovereign guarantee. • The US runs the same spread at sovereign scale - it borrows near 3.1% while nominal GDP grows near 6% - a ~3pp cushion, though most of that growth print is inflation, not real output. • That cushion isn't permanent. It has swung to extremes twice before (1982, 2022) and back; Japan has run a negative version of it for three decades, and its own cushion has compressed from over 4pp to under 1pp as the BOJ normalises. • The US carries no default risk - it borrows in the currency it prints. Its risk is debasement: inflation or a term-premium re-rating that closes the gap faster than growth can defend it. Bottom line: the trade still works, for now - but it's a spread, not a law of physics, and Japan is showing in real time what it looks like when one starts to close. |
Two balance sheets, of wildly different size, are running the identical trade. Indian banks just closed out an FCNR mobilisation campaign that pulled in north of $100bn, much of it through leveraged structures. The US government owes $40 trillion, and adds to it every quarter. Different currencies, different regulators, different postcodes.
Underneath, it's the same arithmetic: borrow at one rate, earn or grow at a higher one, and let the spread do the work for as long as it lasts.
The FCNR Trade, In Miniature
The FCNR structure is simple enough to fit on a term sheet. Gift City branches of Indian banks lent depositors money at 5.7-5.8%; the FCNR deposit itself earned 6-6.25%. A spread of 30-55bps doesn't sound like much until leverage gets involved - 9x was commonly offered, and structures as high as 19x have been seen. Lever a 40bp spread 9 times and the depositor is earning a genuinely attractive return on capital, for taking what looks, on the surface, like bank-deposit risk.
Why did depositors do it? Not because the spread was large - it wasn't - but because of a belief that the underlying deposit carried a defacto sovereign guarantee. Once that belief is in place, there is no theoretical limit to how much leverage makes sense, as long as the spread stays positive. That's the mechanism worth borrowing for this note - not the FCNR trade itself, which is a niche, well-collateralised private banking product and not our focus, but the logic that a positive, believed-safe spread invites leverage without an obvious ceiling, until credit risk reasserts itself as the constraint nobody was pricing.
The Same Logic, A Much Bigger Balance Sheet
Is the US government running a version of the same trade? Structurally, yes - a borrower financing itself as long as the cost of borrowing stays below the growth rate of the thing being financed against. That's the r-versus-g condition economists have used to think about debt sustainability for decades: as long as the effective interest rate on the debt (r) sits below the nominal growth rate of the economy (g), the debt-to-GDP ratio doesn't need primary surpluses to stabilise. Growth does the deleveraging.
Where does the US sit today? The effective interest rate on total federal debt outstanding - interest expense divided by the debt stock, not the marginal 10-year yield - was 3.1% in the first quarter of 2026. Nominal GDP grew 6.1% year-on-year over the same quarter. That's a cushion of just under 3 percentage points - g comfortably above r, for now.
Worth flagging before that cushion looks too comfortable: most of it is inflation, not growth. Real GDP grew 2.7% year-on-year over the same quarter - the rest of the 6.1% is the deflator, running hot on tariffs and the energy shock from the Iran conflict. That doesn't weaken the argument - it sharpens it. A cushion built on an inflation impulse is a cushion that shrinks the moment the Fed succeeds in doing its job.
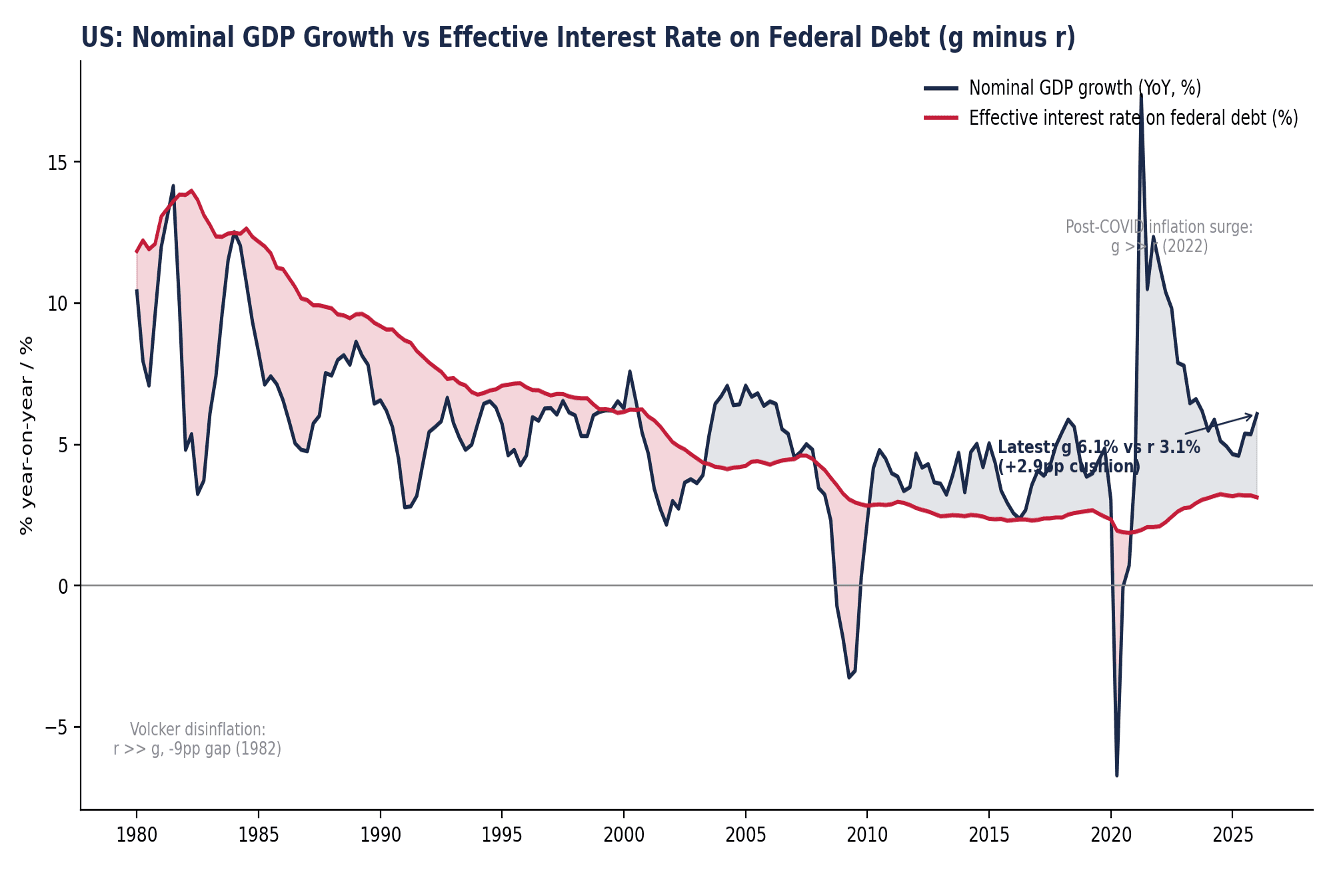
The chart is more useful for what it's done before than for where it sits today. Twice in the last 45 years the gap has swung to an extreme and back. In 1982, at the peak of the Volcker disinflation, r ran 9 percentage points above g - about as unsustainable as the arithmetic gets - and the debt-to-GDP ratio did rise through the 1980s. It didn't cause a default. It forced a policy response: two decades of disinflation that eventually let growth catch back up, followed by the fiscal consolidation of the late 1990s. In 2022, the opposite extreme - g ran 9-11 points above r, as the inflation surge lifted nominal GDP faster than the Fed could reprice a debt stock still carrying pre-2022 coupons. That gap was, in effect, an unplanned inflation tax on existing bondholders - a stealth deleveraging that did more to hold the debt ratio down than any spending discipline did.
Japan Already Ran This Experiment - Twice
If the US case worries you, Japan is the control group, and it's been running the experiment for three decades - just not in the direction you'd expect. From the mid-1990s to around 2012, Japan actually ran with 10-year JGB yields above nominal GDP growth for most of that stretch - 62 of 72 quarters, by our count. That's r > g, the textbook "unsustainable" condition, sustained for the better part of two decades through the deflationary years, when nominal growth was flat or outright negative even as JGB yields stayed low but stubbornly positive. It didn't blow up, because the debt was yen-denominated, overwhelmingly domestically held, and absorbed by a central bank willing to own approximately 50% of the outstanding stock. Only with Abenomics-era yield suppression from around 2013 did the relationship flip - yields fell far enough, toward zero and then negative, that g sat above r in 24 of the next 32 quarters through 2020. Two different decades, two different versions of the arithmetic, no debt crisis in either.
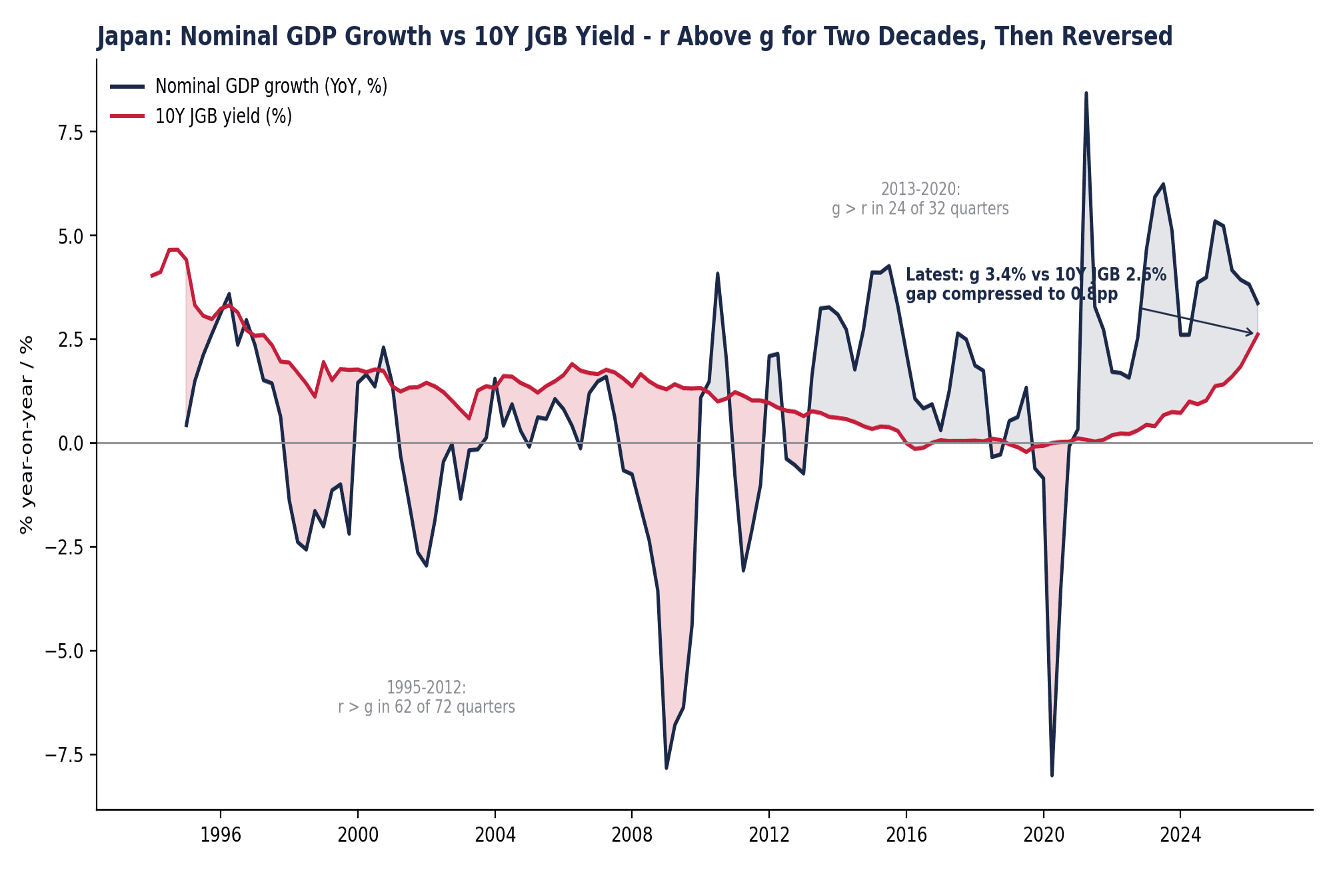
What's live right now is the second half of that experiment. Japan's own reflation - helped along by the same global inflation impulse that hit everyone else - has pushed nominal GDP growth up to 3.4% as of Q2 2026, while the BOJ's exit from yield-curve control has taken the 10-year JGB from near zero to 2.6% over the same window. The gap that sat above 4 percentage points as recently as 2023 has compressed to under 1 point. Japan isn't in crisis. But the multi-decade version of the trade that looked free for 25 years is now visibly repricing in real time, and that's the more relevant precedent than 1982 for what a compression - rather than an inversion - looks like.
Where the Analogy Stops
The FCNR trade is only useful here for the spread concept - it isn't a template for US debt instrument-for-instrument. An FCNR depositor knows their spread on day one, fixed for the term. The US has no such luxury: it refinances continuously, across every maturity, and the marginal cost is set by the market each week, not agreed once at inception. Treasury has been actively managing which maturities absorb that pressure - 84% of 2025's gross issuance came in bills of 12 months or less, the highest share since the financial crisis, precisely to keep the near-term coupon down while the back book of longer notes still carries older, cheaper rates. That's the same playbook the Ministry of Finance and the BOJ ran for a decade - keep duration short, keep the average below the growth rate, defer the reset - and it buys time the same way, with the same catch: a shorter-duration liability structure means the next rate shock hits the interest bill faster than it would with a longer-dated book.
Default Versus Debasement - Two Different Endings
Push the spread trade far enough and both structures eventually meet a credit question. But it isn't the same credit question. FCNR's tail risk is a discrete event - a bank default or restructuring. The closest real-world test is Yes Bank in 2020, where uninsured depositors were made whole through a forced merger engineered by the RBI. That outcome reinforced the belief in a defacto guarantee; it didn't legally establish one, and it has never been tested by an outright failure with no rescue on the other side.
The US doesn't face a default risk in nominal terms - it borrows in the currency it prints. Its tail risk is currency debasement, persistent above-target inflation, or a disorderly repricing of the term premium: a slower, less binary unwind than a bank failure, but not a costless one for anyone holding the debt or the currency.
So When Does It Become Unsustainable?
Not at a single number. The r-g framework tells you the direction of travel, not a trip-wire level - Japan proved you can run a negative gap for decades if the buyer base is deep and captive enough. What would actually change the call:
Confirmation Signals - the cushion is closing for real
• The effective rate on federal debt crosses above trend nominal GDP growth on a sustained, multi-quarter basis - not a single inflation-driven quarter reversing.
• CBO's net-interest-to-outlays ratio keeps climbing past the 14.5% already pencilled in for FY2028, rather than levelling off.
• The bill share of issuance keeps rising past 2025's 84% even with the Fed on hold - or hiking, as markets were pricing into the September 2026 meeting - rather than cutting: a sign short-dated funding has become structural, not just a bet on falling rates.
• Term premium re-rates higher independent of Fed policy - a genuine buyers' strike at auction, not just cyclical positioning.
Denial Signals - the cushion holds
• AI-capex-driven productivity gains lift trend real growth without needing an inflation assist to keep nominal GDP elevated.
• Nominal GDP growth stays high for growth reasons rather than price reasons - a healthier mix than 2022-23.
• The effective rate keeps lagging market yields for years, the way it did after 2022, because the back book was termed out cheaply.
• Auction demand, foreign and domestic, stays deep enough that new supply clears without a growing concession.
What This Means For Positioning
None of this argues for panic, and it doesn't argue for complacency either. The cushion is real today - it just isn't permanent, and it isn't a straight line. A few implications worth carrying into portfolio conversations: duration exposure should be sized for a world where the marginal cost of US financing is more likely to drift up than down over the medium term, given the bill-heavy issuance mix now in place; inflation-linked exposure earns its keep as a hedge against the debasement path rather than the default path; and Japan's live compression is the more instructive real-time signal to watch than any US-specific data point, precisely because it's further along the same curve.
America isn't running out of rope. It's paying more for every extra foot of it, one auction at a time - and Japan just showed the world what happens when the bill for cheap financing finally comes due.
Sources: US Treasury Fiscal Data (Interest Expense and Average Interest Rates), FRED (GFDEBTN, A091RC1Q027SBEA, GDP, IRLTLT01JPM156N, JPNNGDP), US Bureau of Economic Analysis, Congressional Budget Office, US Treasury Borrowing Advisory Committee presentations (Q4 2025, Q1 2026), RSM Market Minute (13 Jan 2026).